Company
Thisco Pte Ltd
My Deliverables
Web, Android and iOS Design. Project Management. Manual and Automation Testing. Web Development
Tools
Figma, Adobe XD, Webflow, Visual Studio Code, Jira, Cypress & Octoparse
Durations
2021 - 2022
Project Overview
Thisco is a revolutionary B2B platform based in Singapore, designed to empower entrepreneurs by simplifying the process of launching supply businesses. My role as a Product Developer was to design, manage, and optimize the platform's user experience, ensuring seamless interaction between aggregators, partners, and suppliers.
Problem Statement
The traditional supply chain model is often hindered by high entry costs and complex logistics. Thisco aimed to eliminate these barriers by offering a user-friendly platform. My goal was to create intuitive interfaces and smooth user experience flows that would allow suppliers to efficiently launch and manage their businesses.
My Role
I took charge of designing user interfaces for both aggregators and partners, ensuring that the design catered to the specific needs of each group. Additionally, I managed the project’s timelines, facilitated quality assurance through manual and automated testing, and optimized user experience flows to enhance the platform's overall usability.
I was responsible for the full cycle of product development, ensuring an intuitive and user-friendly platform for both aggregators and suppliers.
Scope of work
- UI/UX Design (Web, Android, iOS)
- Manual & Automation Testing
- Project Management & Web Development
Design Process
I followed a user-centered design approach, starting with wireframes and user flows to ensure that both aggregators and suppliers could intuitively navigate the platform. I collaborated closely with stakeholders to refine the interface, ensuring that every interaction met their needs and aligned with Thisco’s mission.
Design mockups (desktop and mobile)
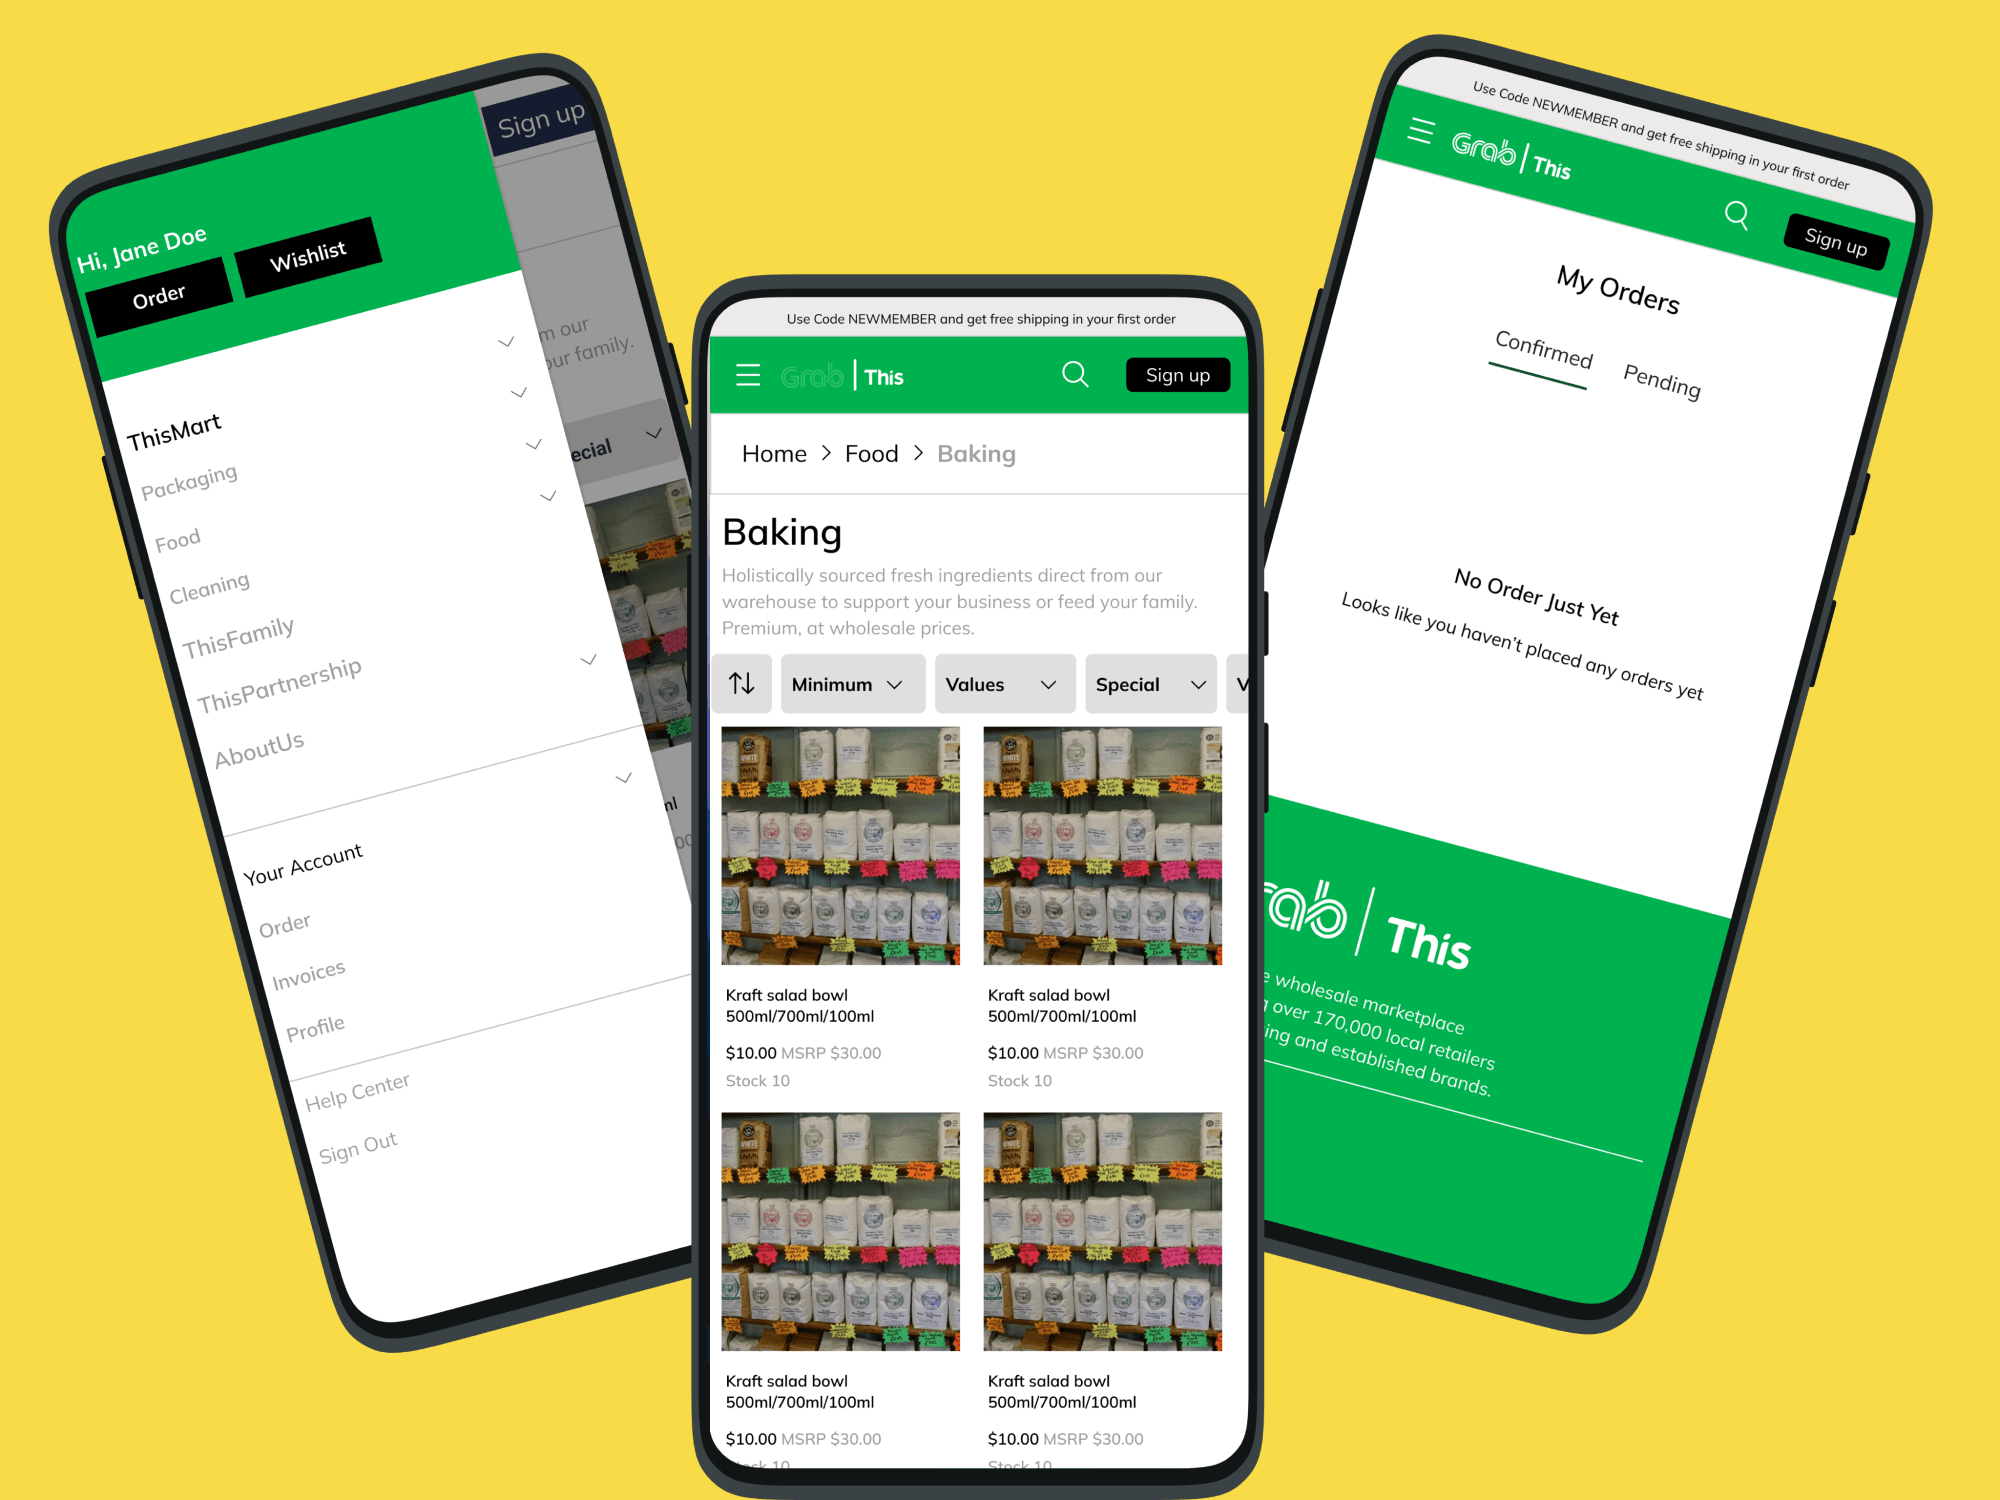
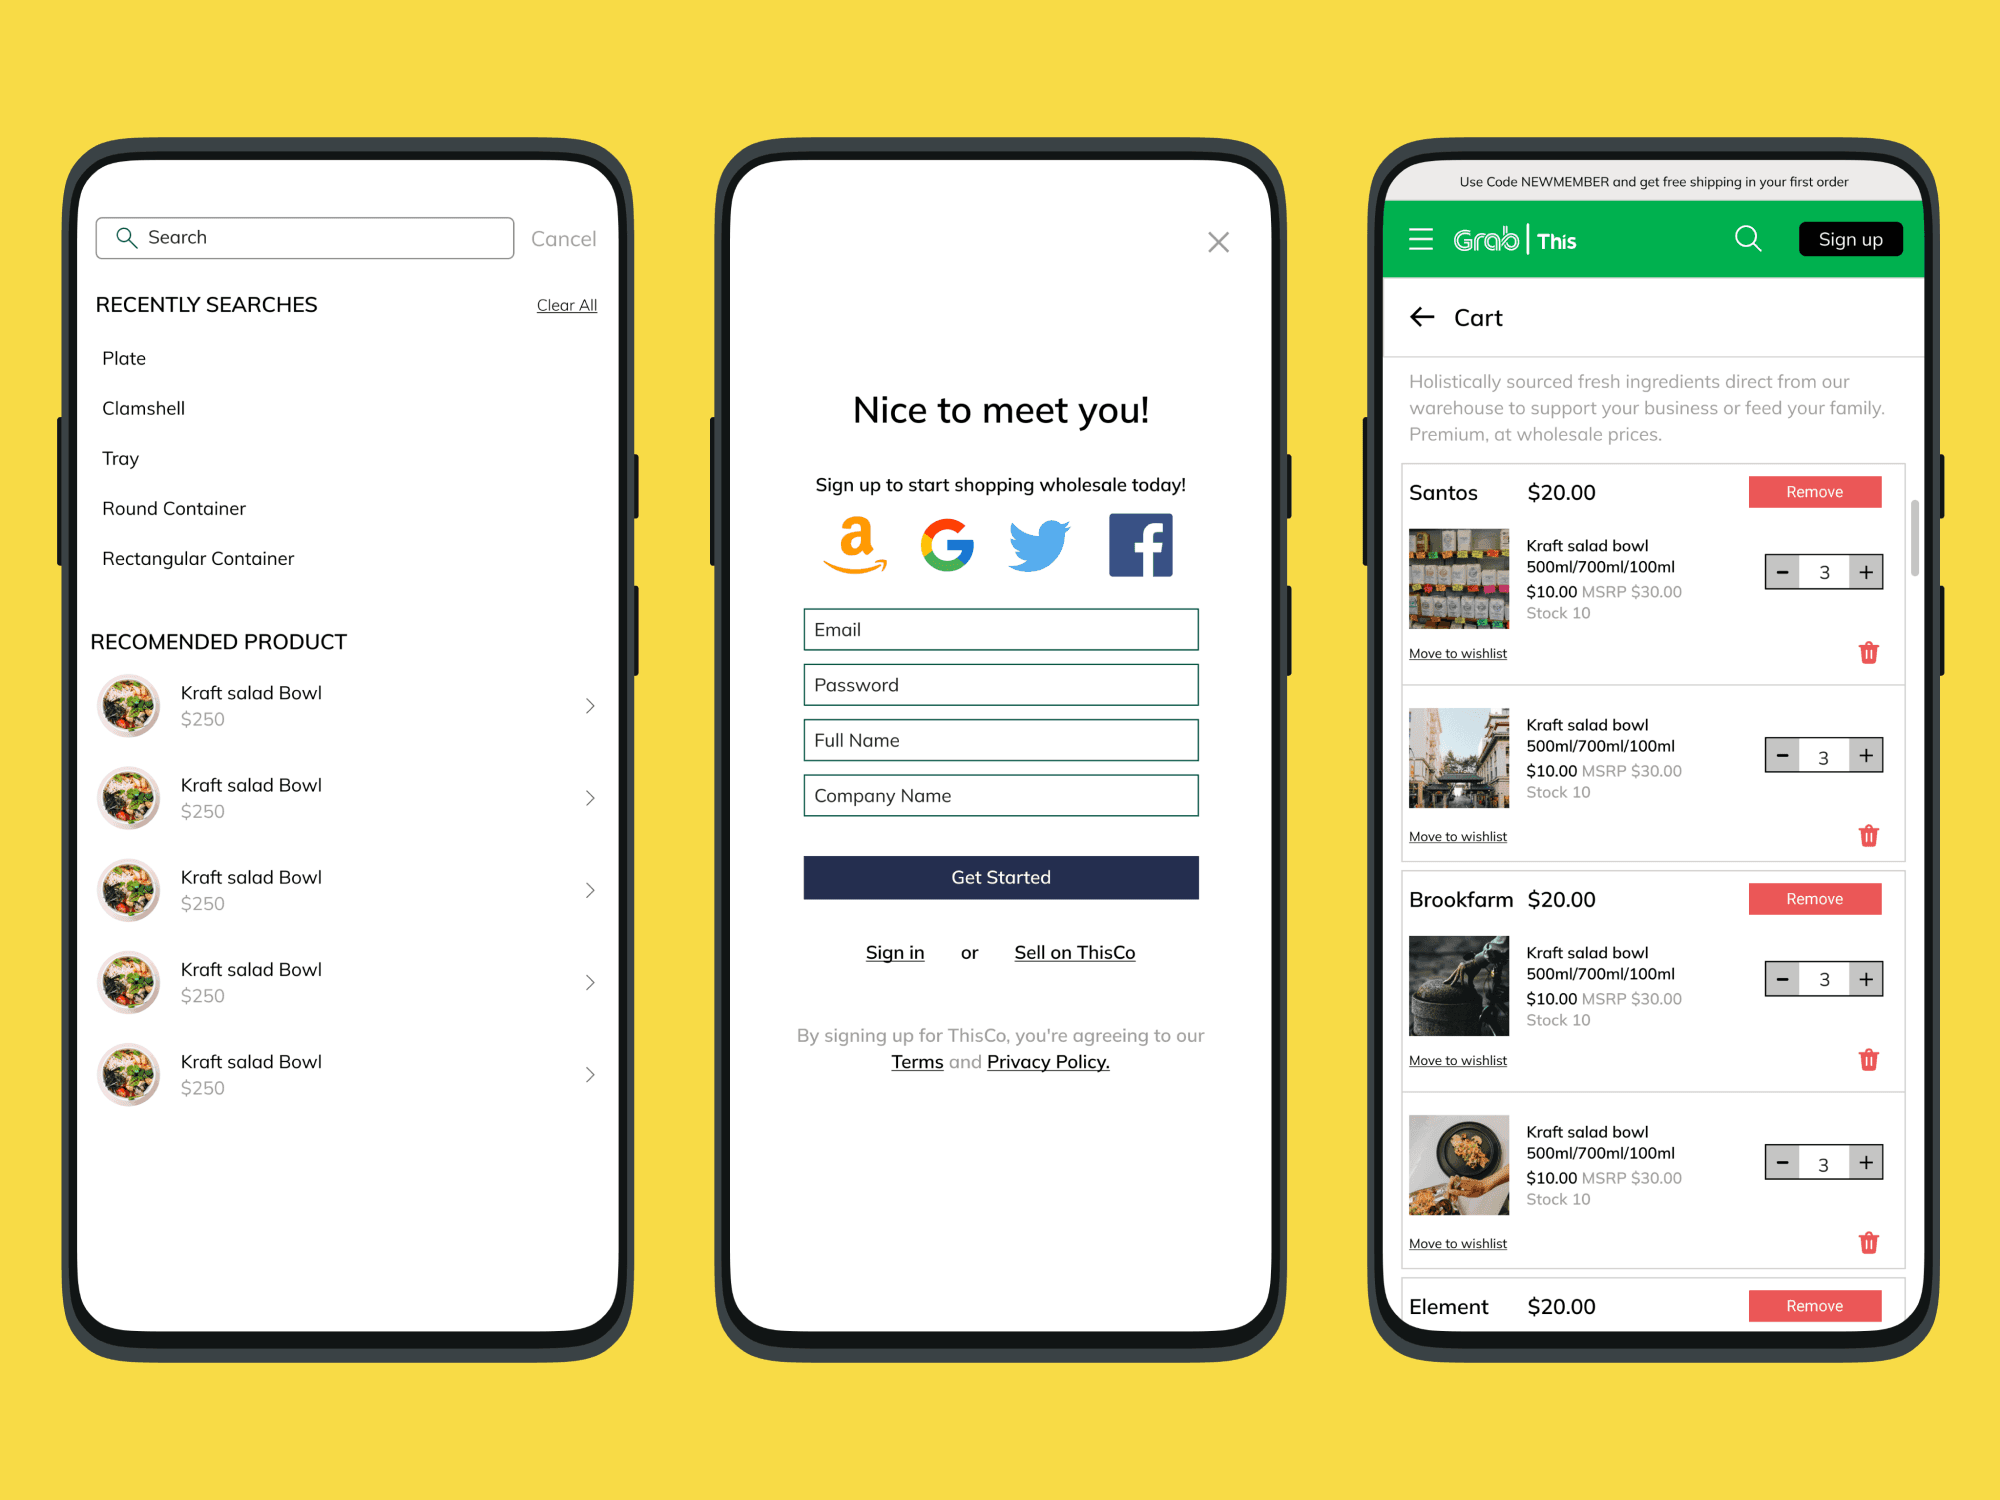
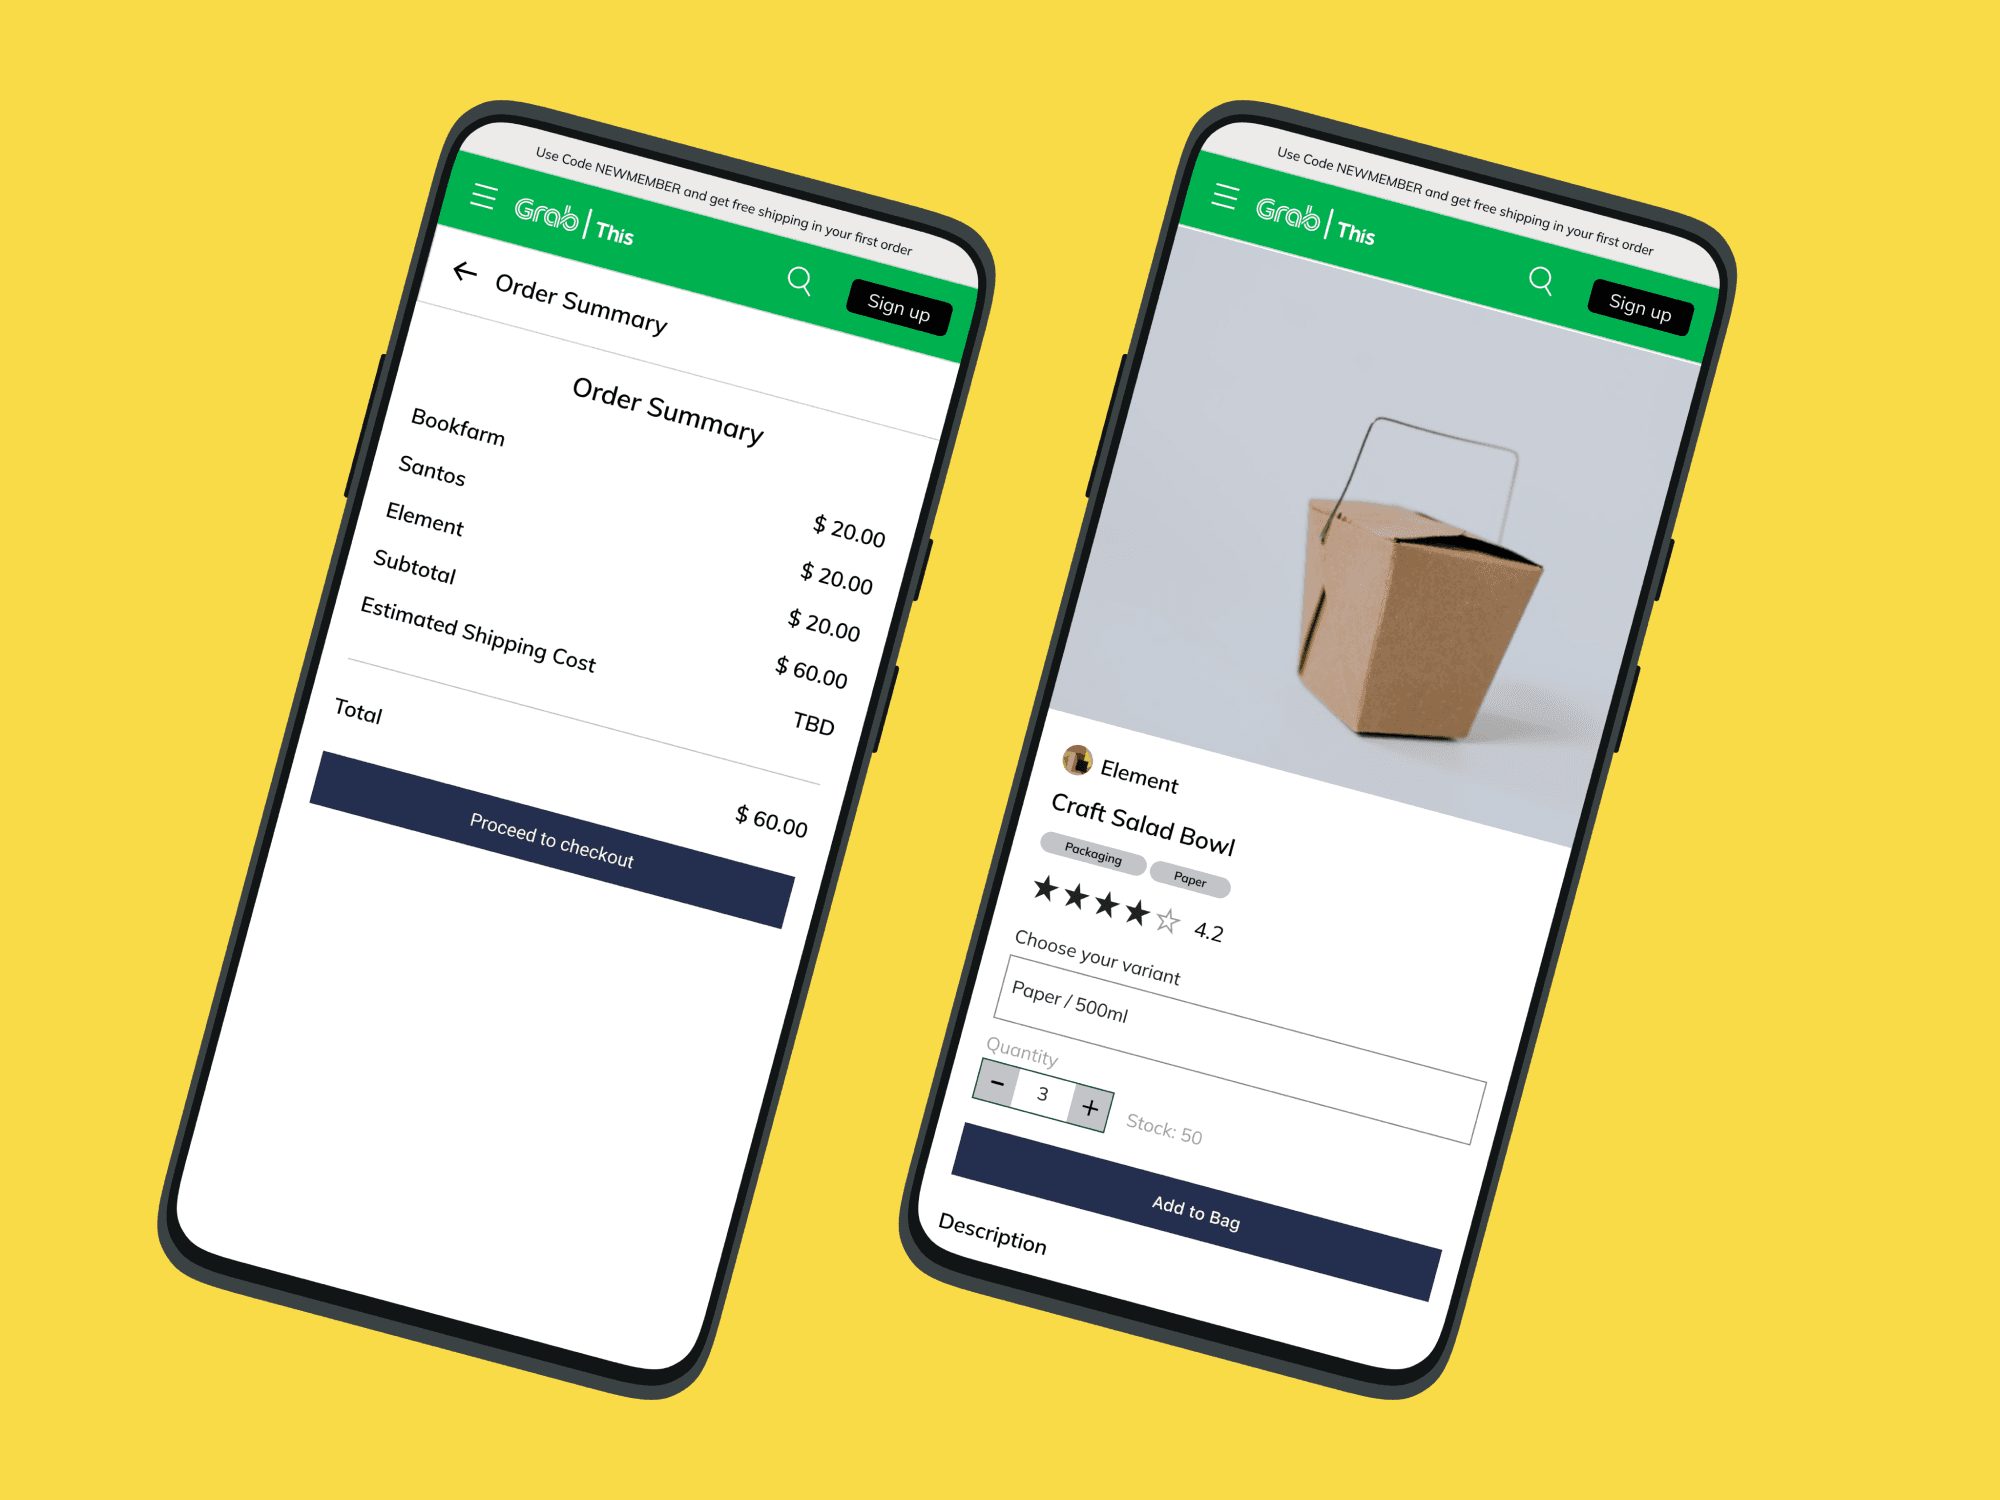
 mobile view mockup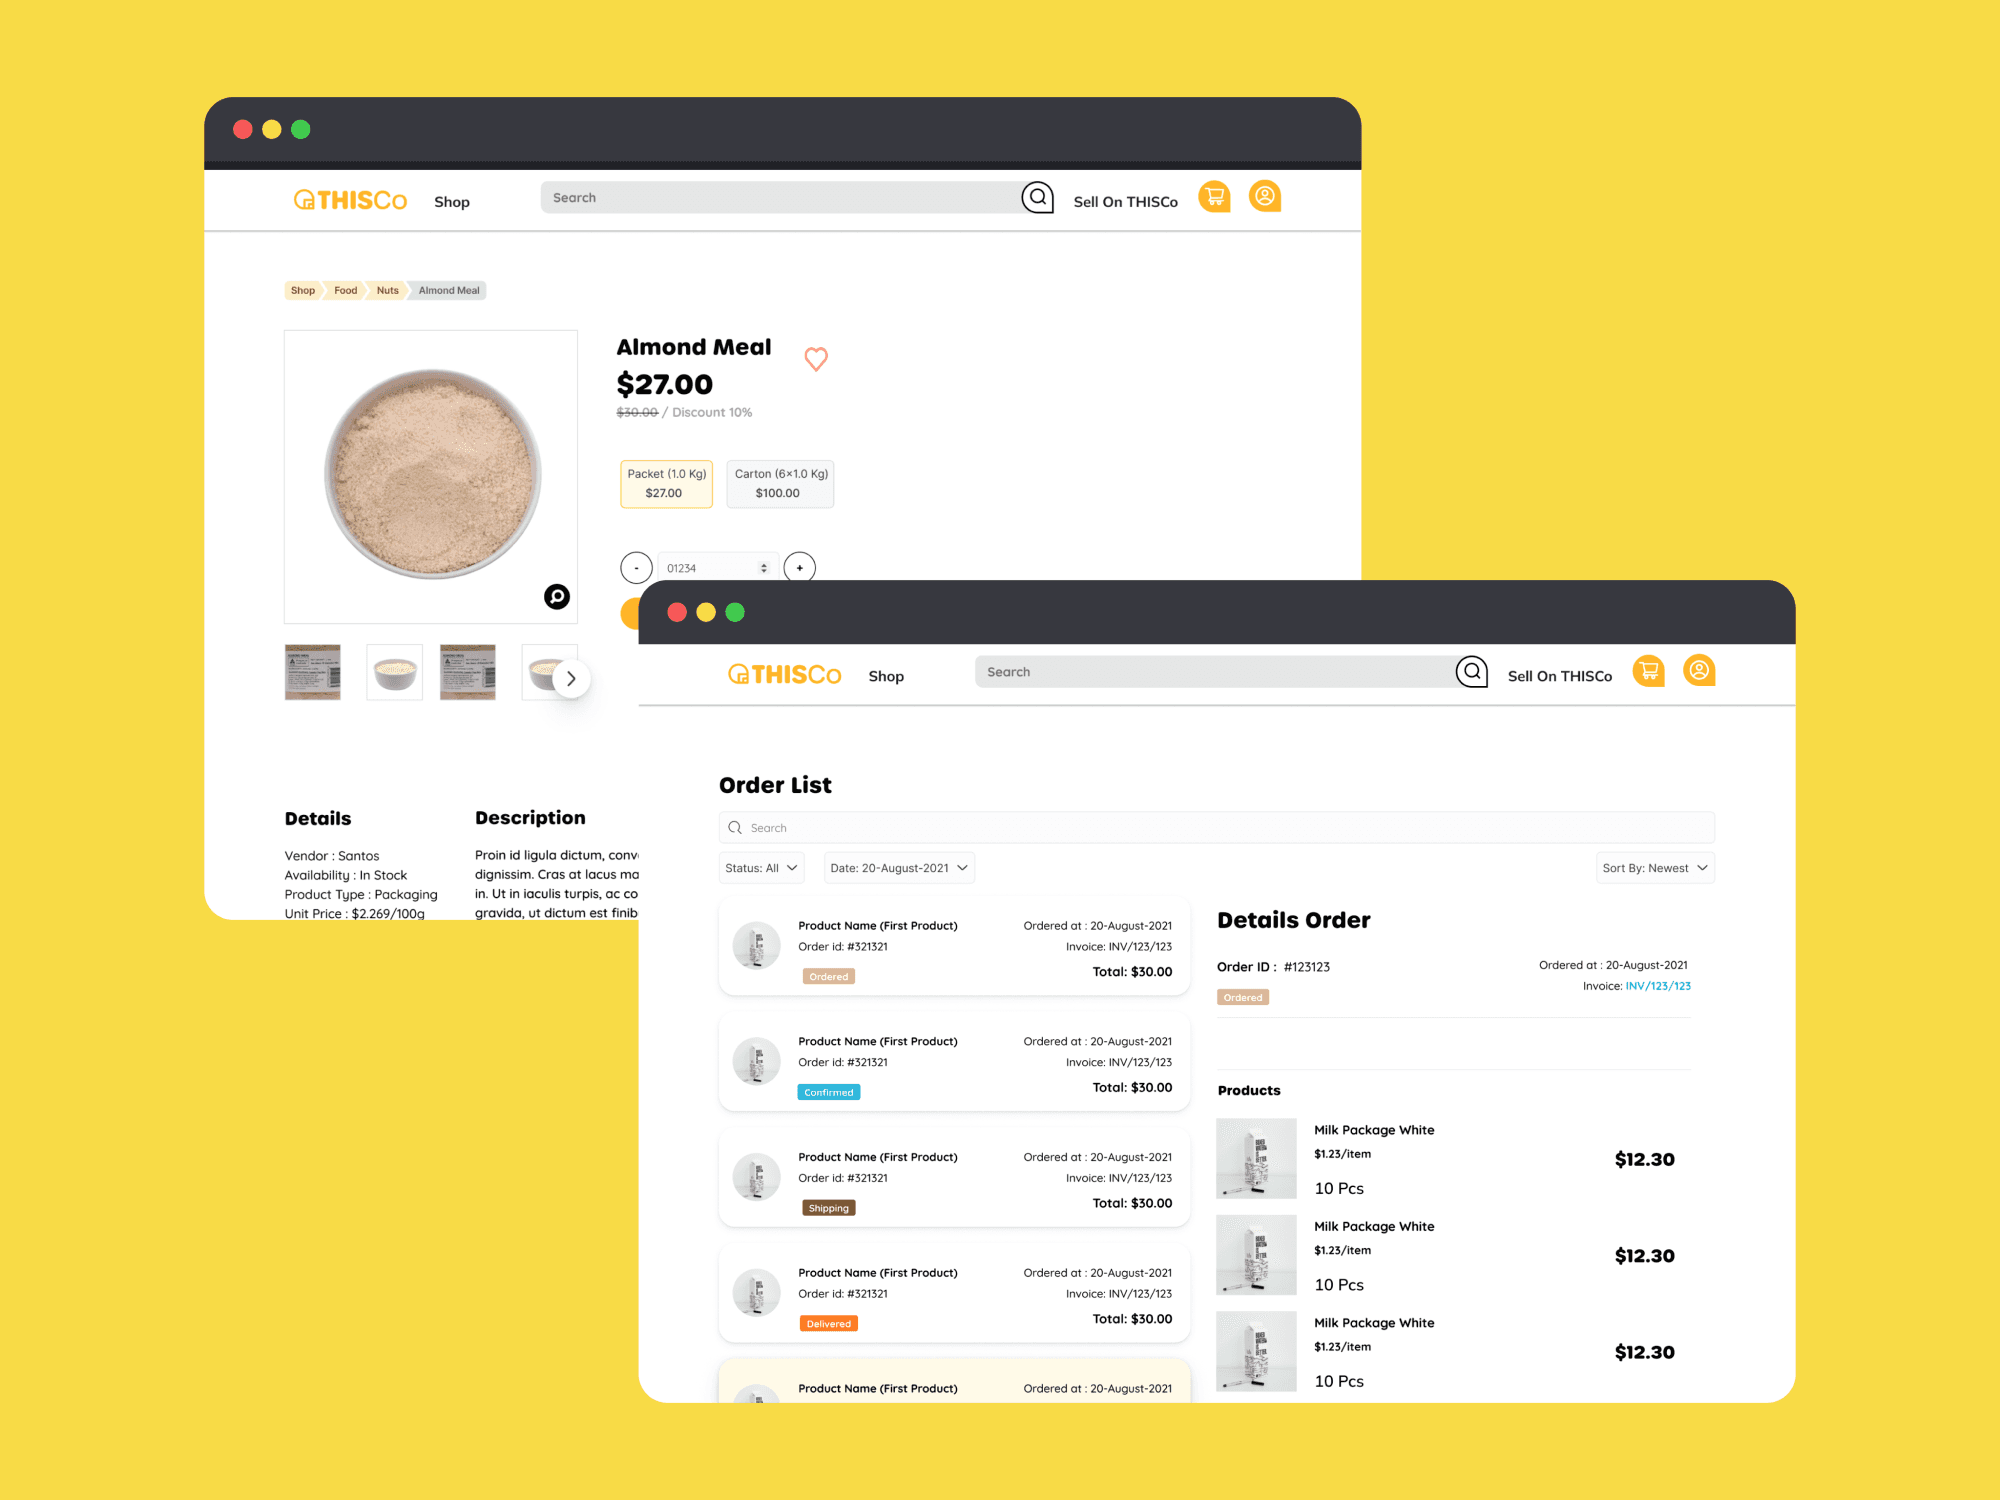
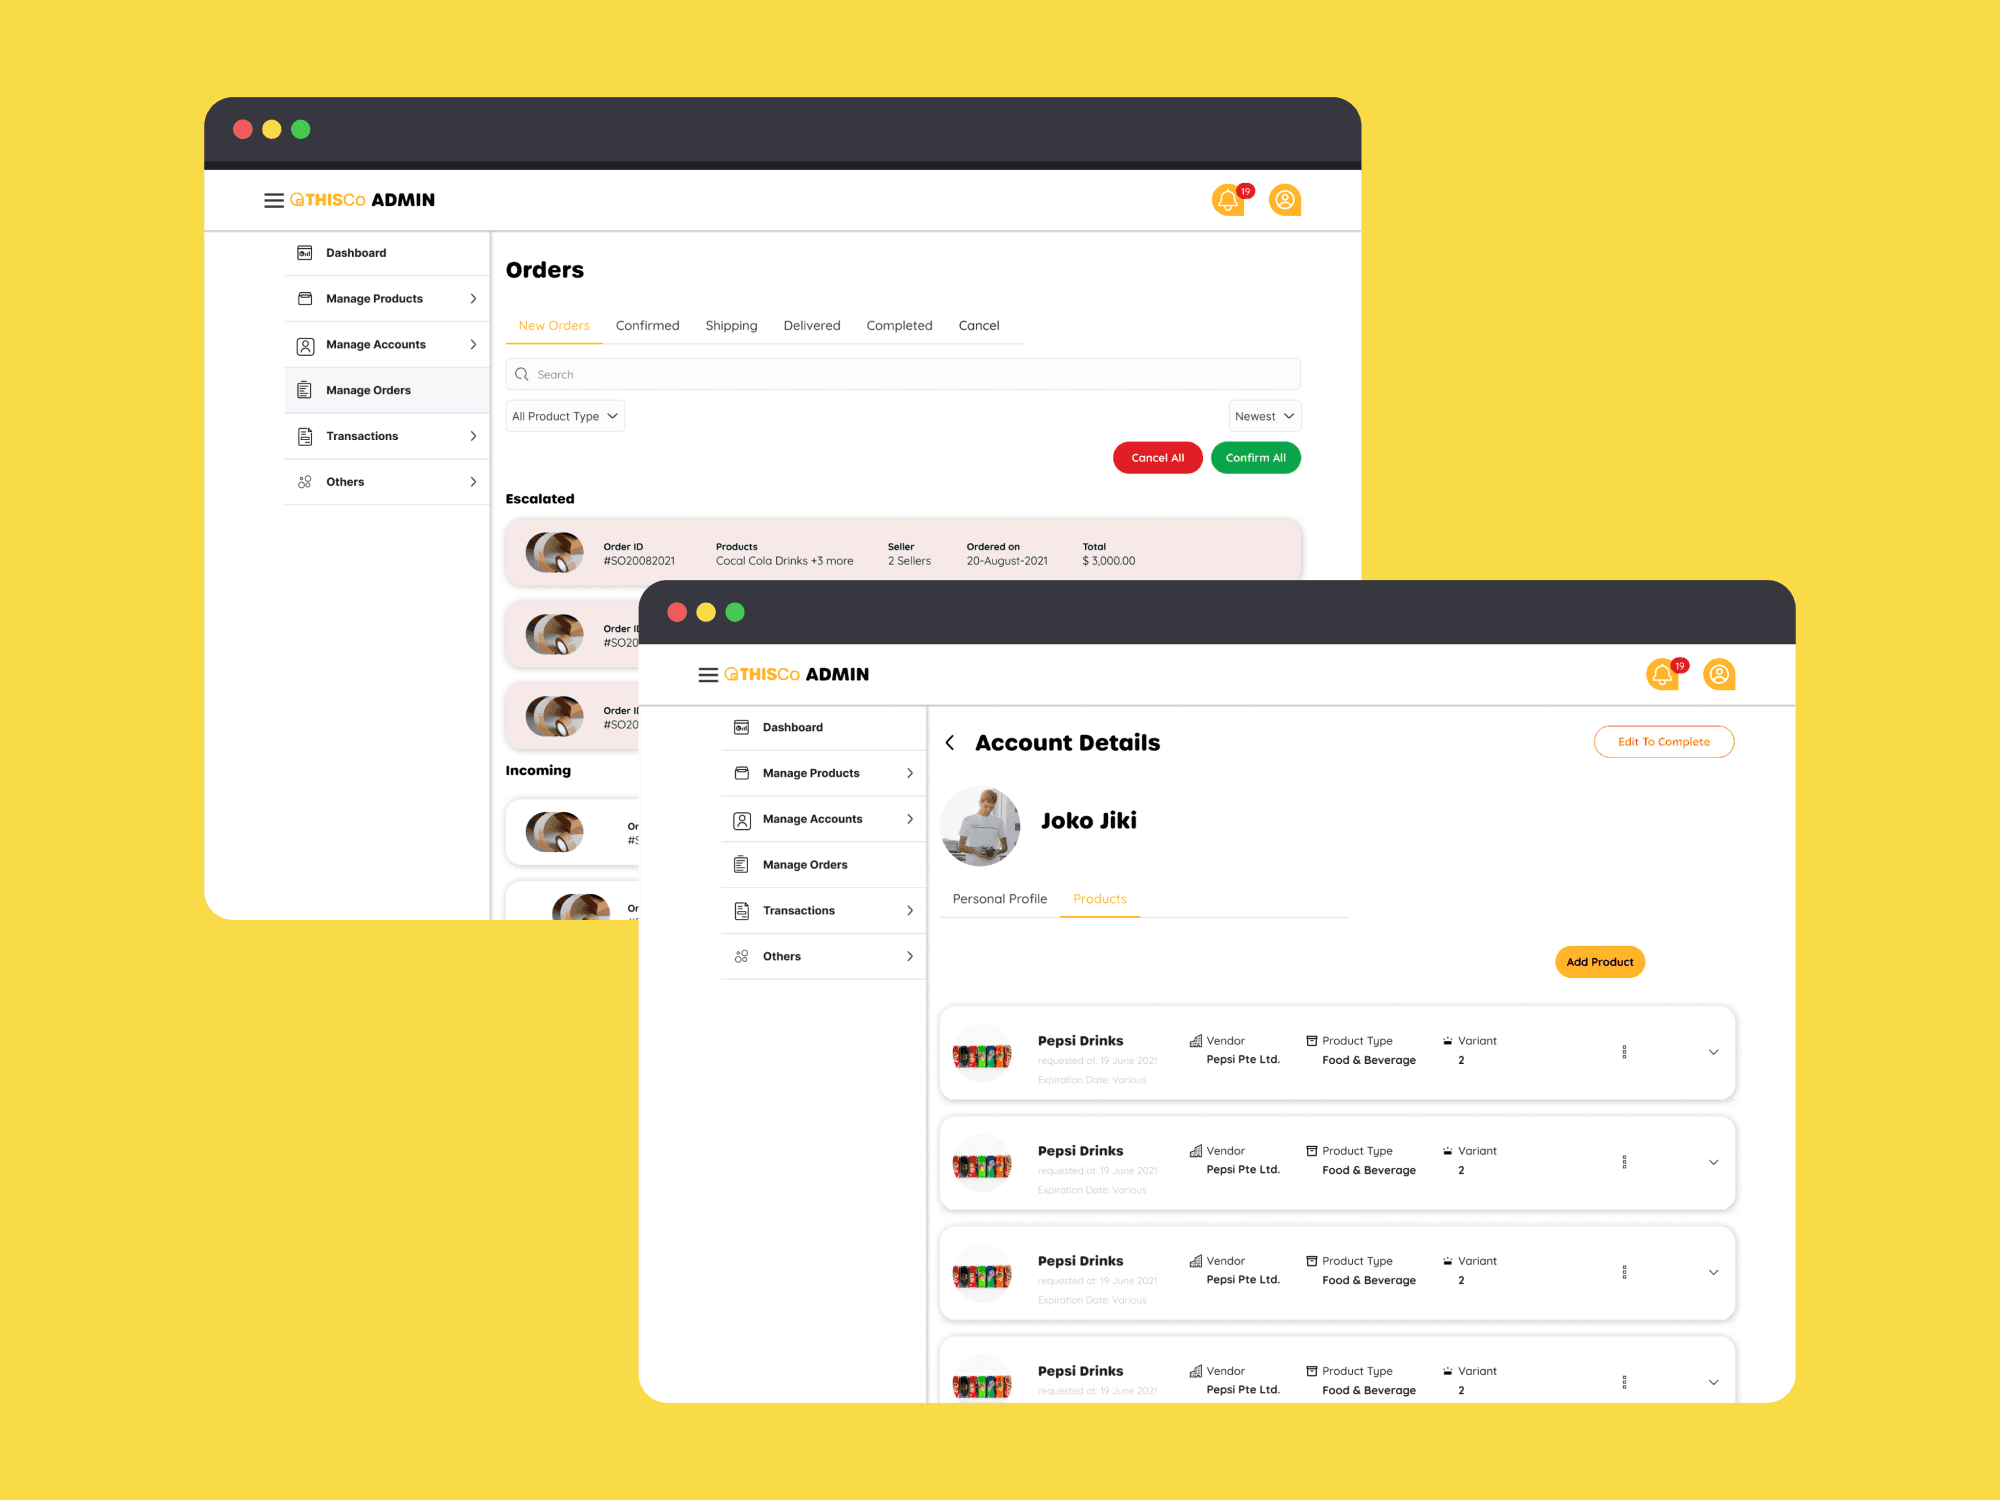
 Desktop view seller, admin and aggregator mockup
User journey maps for suppliers and aggregators
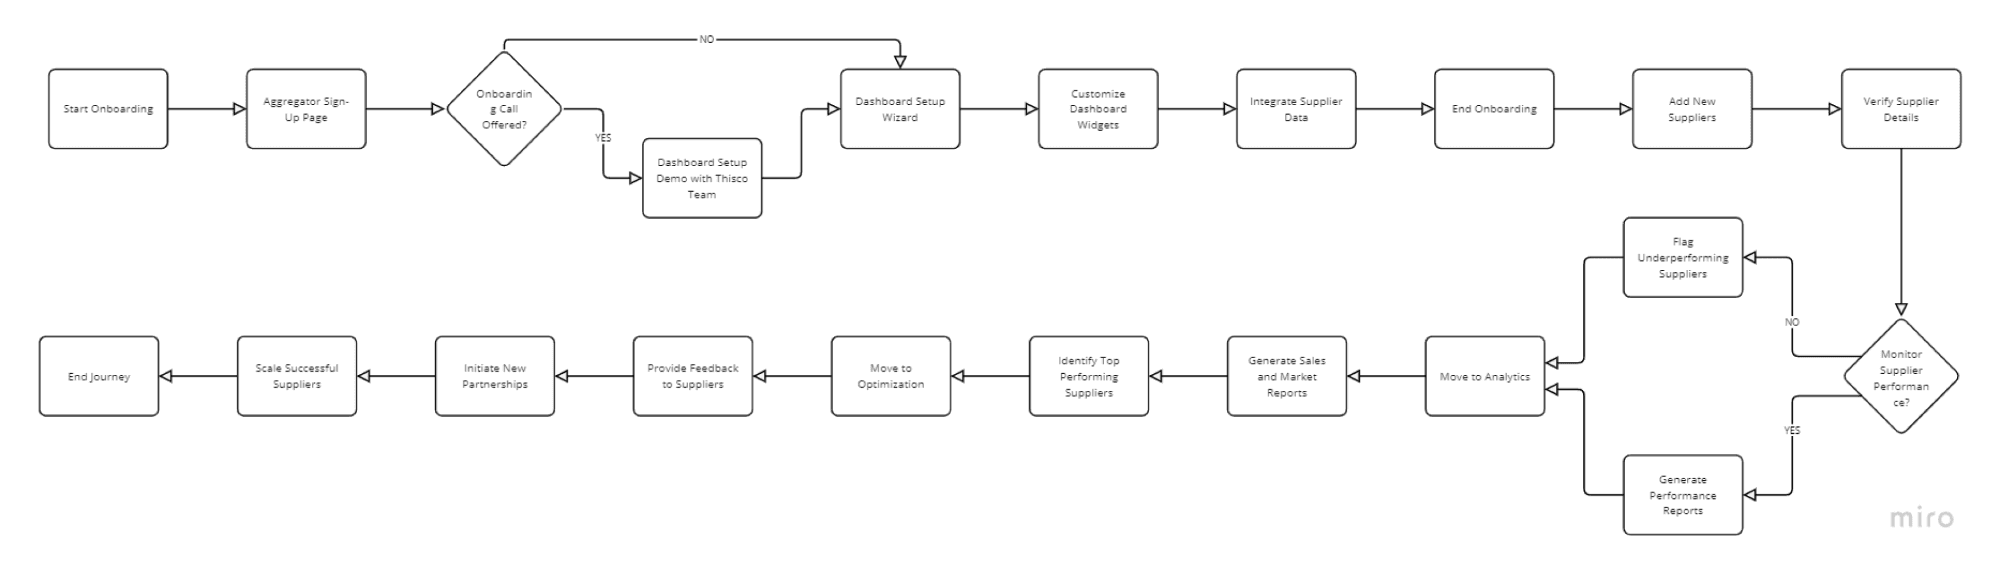
 user journey for supplier and aggregator
- Design challenges and how you overcame them
Balancing Complexity with Usability
The Challenge
The platform needed to cater to two distinct user groups—aggregators and suppliers—each with different needs and levels of technical expertise. Aggregators required access to complex data sets and analytics, while suppliers needed a simple, intuitive interface to manage their inventory and salesMy solution
I addressed this by creating two distinct user interfaces within the platform. For aggregators, I designed a dashboard with customizable data widgets that allowed them to access detailed analytics without overwhelming the UI. For suppliers, I created a simplified, task-oriented interface that guided them step-by-step through their core functions, such as product listing and inventory management. Usability testing with both user groups ensured that the design met their needs while remaining easy to use.
Ensuring Mobile Responsiveness
The Challenge
Since many suppliers and aggregators would access the platform on mobile devices, it was crucial to create a fully responsive design that worked seamlessly across desktop, Android, and iOS.My solution
I implemented a mobile-first design approach, starting by designing key screens for mobile devices and progressively enhancing them for desktop. This ensured that the core functions were accessible and user-friendly on smaller screens. I also conducted extensive testing across different devices and screen sizes to ensure consistency in design and functionality, which led to an optimized mobile experience without sacrificing any key features.
Managing Complex User Flows for Suppliers
The Challenge
The supplier onboarding and product listing processes were complex, involving multiple steps and various inputs, such as inventory details, pricing, and shipping options. If not handled correctly, these processes could overwhelm new users.My solution
I broke down the supplier journey into smaller, manageable steps and introduced progress indicators that showed users where they were in the process. Additionally, I included contextual tooltips and inline guidance to help users understand the purpose of each step without leaving the page. This approach significantly reduced the complexity of onboarding and improved the overall user experience by making the process more intuitive.
Improving Navigation for a Multi-Feature Platform
The Challenge
The platform had numerous features (e.g., supplier management, transaction tracking, analytics, and inventory management), making it difficult for users to quickly find the tools they needed. This was particularly problematic for new users unfamiliar with the platform.My solution
I restructured the navigation system by introducing a sidebar with clear, intuitive categories based on user roles (aggregators and suppliers). For each role, I prioritized the most commonly used features, placing them at the top of the navigation bar. I also implemented a search function that allowed users to quickly access any feature or setting. Through user feedback, I fine-tuned the navigation hierarchy, leading to a 40% reduction in time spent searching for tools.
Maintaining Consistency Across Multiple Platforms
The Challenge
With different development teams working on web, Android, and iOS versions of the platform, maintaining a consistent user experience across all platforms was challenging.My solution
I created a detailed design system that included UI components, color schemes, typography, and interaction patterns, ensuring consistency across all platforms. This system was shared with all developers and teams to standardize the design and interactions on web, Android, and iOS. Regular check-ins and design reviews helped ensure that any variations were addressed before the final product release. The design system not only maintained consistency but also sped up the development process by providing clear guidelines.
User Experience Flow
Mapping out the user experience flows for suppliers was essential in ensuring the seamless operation of Thisco. My process involved identifying potential pain points and creating solutions that enhanced user efficiency, ultimately increasing supplier engagement.
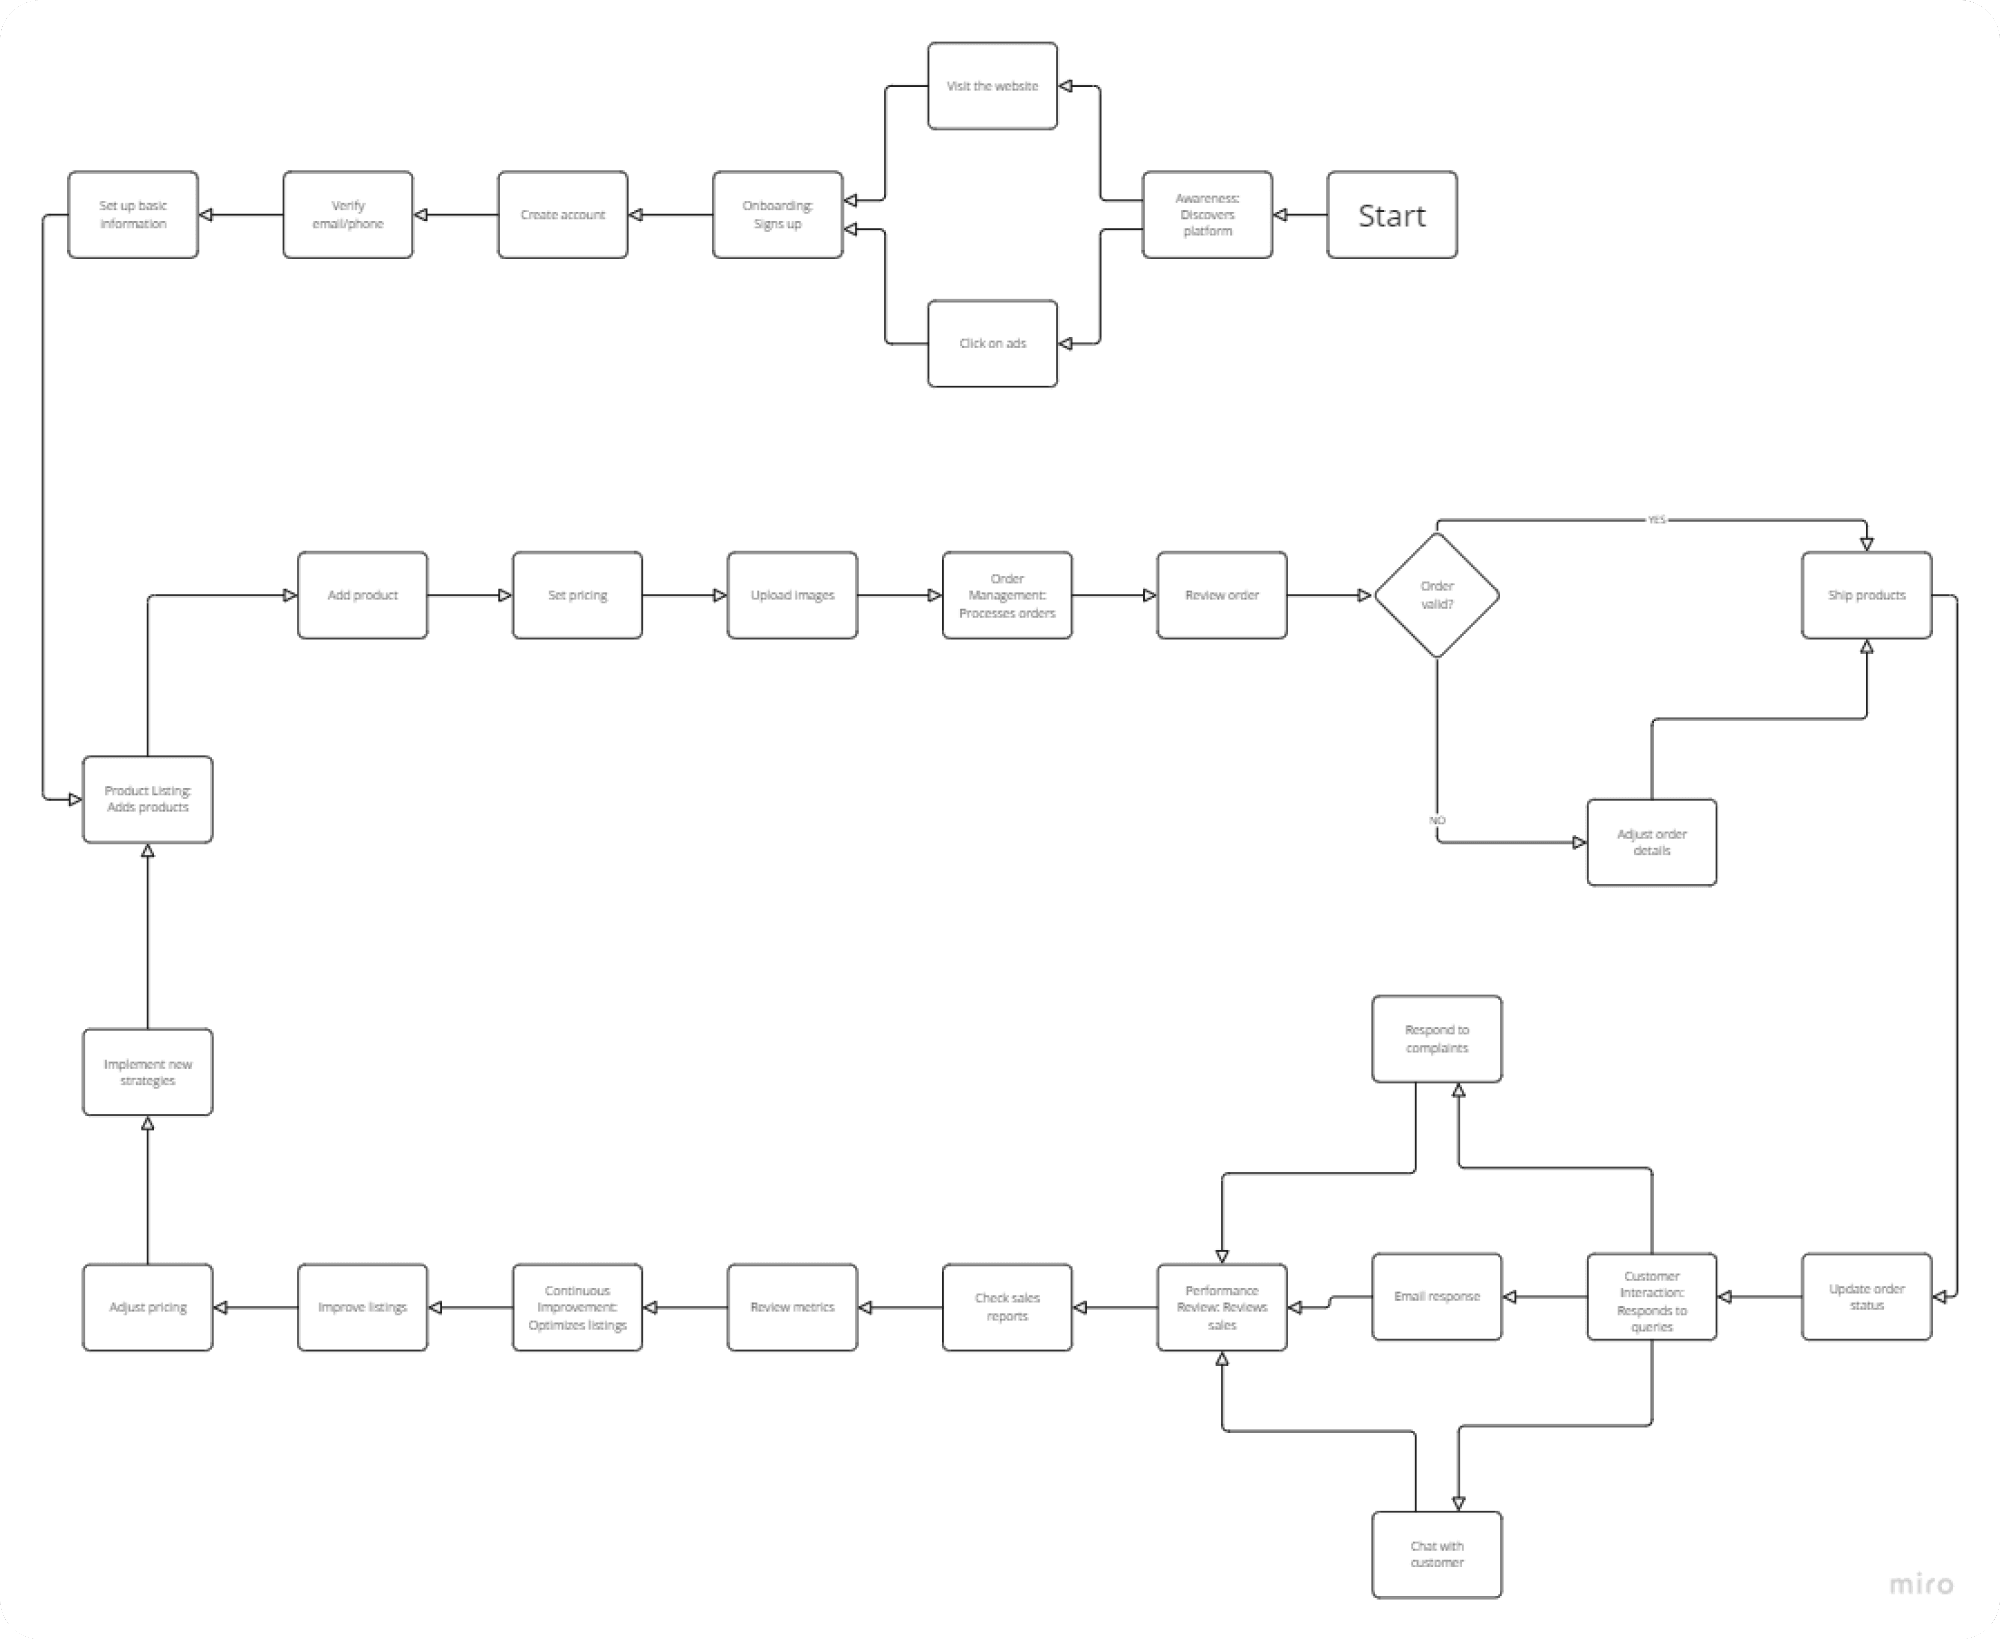
Project Management
As the project manager, I was responsible for overseeing the development timeline, coordinating between design, development, and QA teams, and ensuring that the platform was launched on schedule. By implementing agile methodologies, we were able to iterate quickly and stay on track.
Project Milestones
Milestone Description Due date Status Notes Project Kickoff Initial planning and requirement gathering Jul 7, 2021 Completed Align objectives and scope Design Phase Start Begin UI/UX design for web, Android, iOS Jul 14, 2021 Completed Draft initial wireframes and prototypes Prototype Review Review design prototypes with stakeholders Aug 7, 2021 Completed Incorporate feedback from stakeholders Development Phase Start Begin development for web, Android, iOS Aug 14, 2021 Completed Frontend and backend development Beta Testing Conduct beta testing and gather feedback April 13, 2022 Completed Focus on usability and functionality Launch Preparation Finalize documentation and marketing May 1, 2022 Completed Prepare launch strategy and materials Official Launch Platform goes live May 10, 2022 Completed Launch platform to users Post-Launch Review Evaluate project success and gather user feedback June 5, 2022 Completed Assess performance and user satisfaction Kanban board
Backlog To Do In progress Review Done Gather Requirements Create Initial Design Prototypes Development for Android & iOS Beta Testing Completed Design Phase Design UI/UX Wireframes Set Up Development Environment Manual & Automation Testing User Acceptance Testing Finalize Development Plan Development Sprints Develop Web Platform Implement User Feedback Finalize Documentation Launch Platform
Testing & Quality Assurance
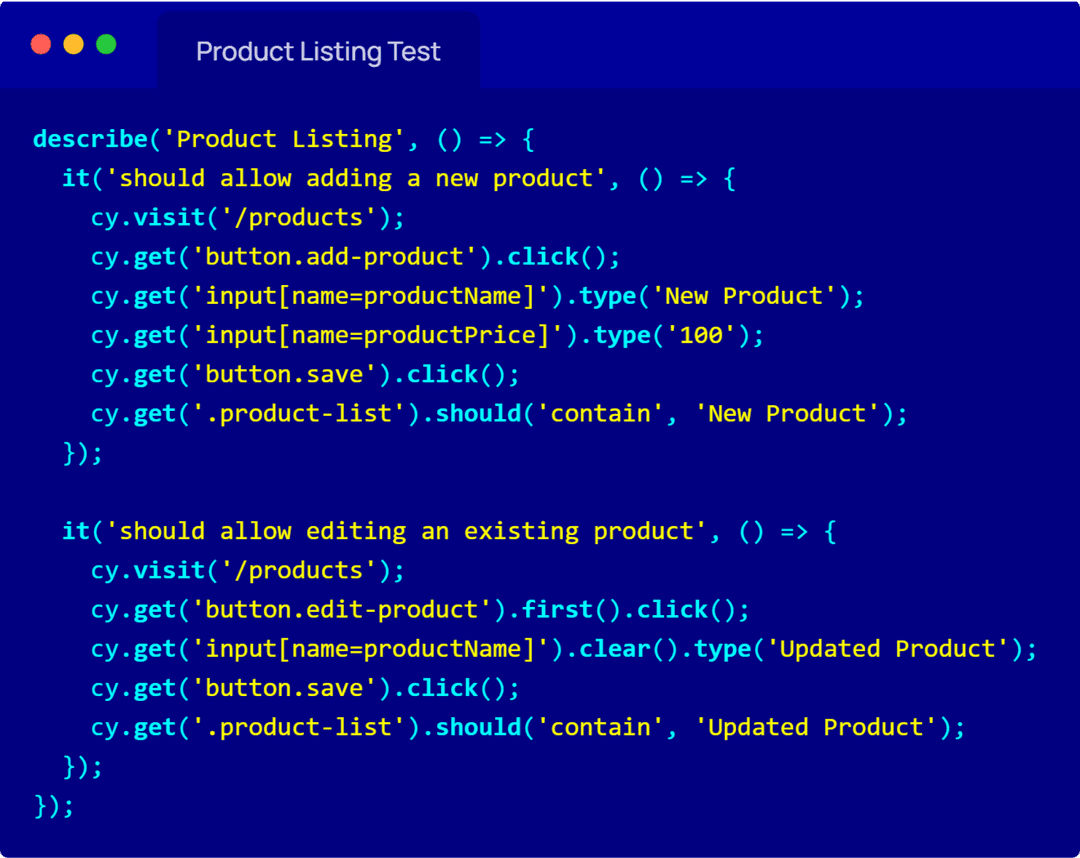
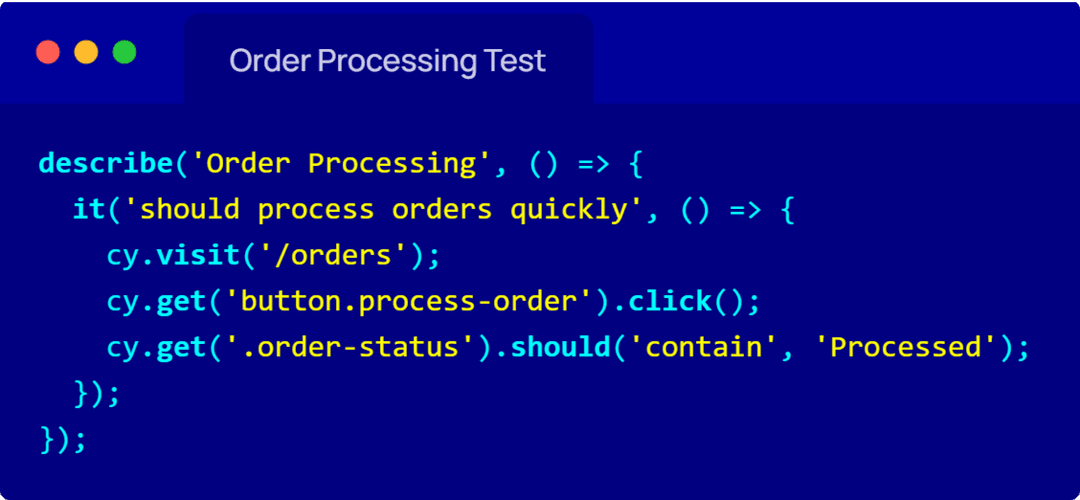
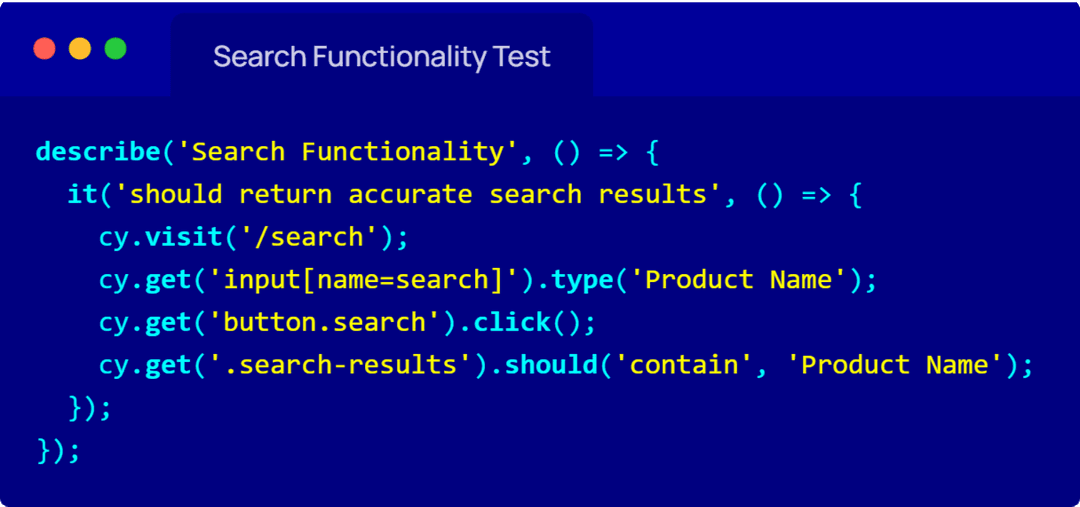
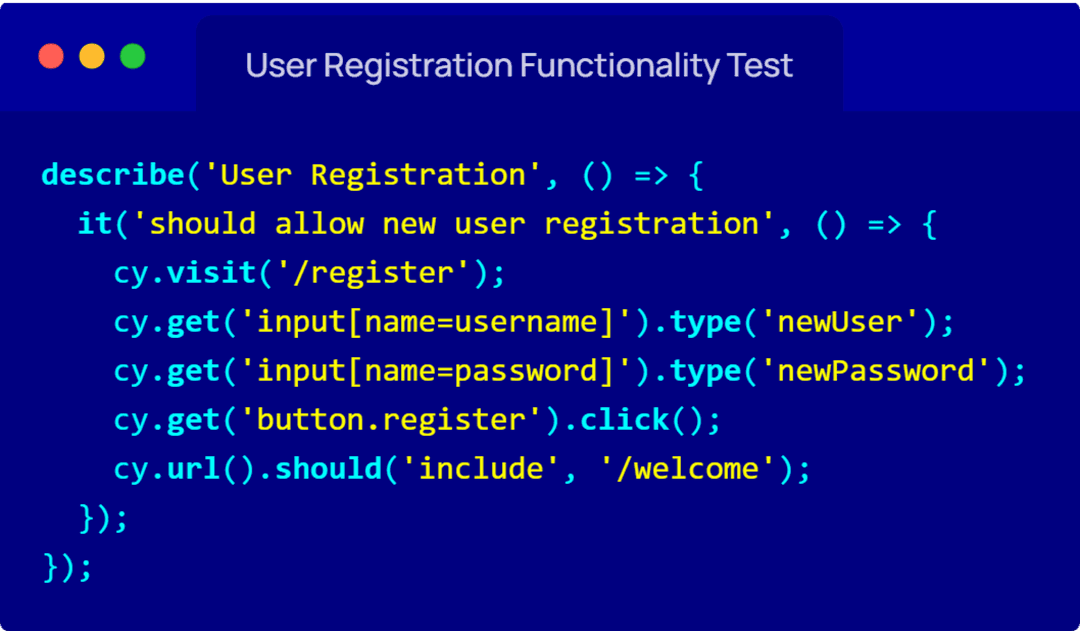
To guarantee platform reliability, I developed comprehensive test cases and conducted manual and automation testing. This rigorous process ensured that all user interactions, from sign-up to transaction processing, functioned without issues.
| Test Case | Description | Before Testing | After Testing | Improvement |
|---|---|---|---|---|
| Login Functionality | Test user login with valid and invalid credentials | Failed (login issues) | Passed (login stable) | Fixed login issues |
| Product Listing | Test adding and editing products | Errors during edit | No issues | Improved product management |
| Order Processing | Test processing orders and payments | Slow processing | Fast processing | -40% Time Reduction |
| UI Responsiveness | Test UI on different devices | Layout issues | Fully responsive | Improved UI consistency |
| Search Functionality | Test search feature for products | Inaccurate results | Accurate results | Enhanced search accuracy |
| User Registration | Test new user registration and validation | Registration errors | Smooth registration | Fixed validation issues |
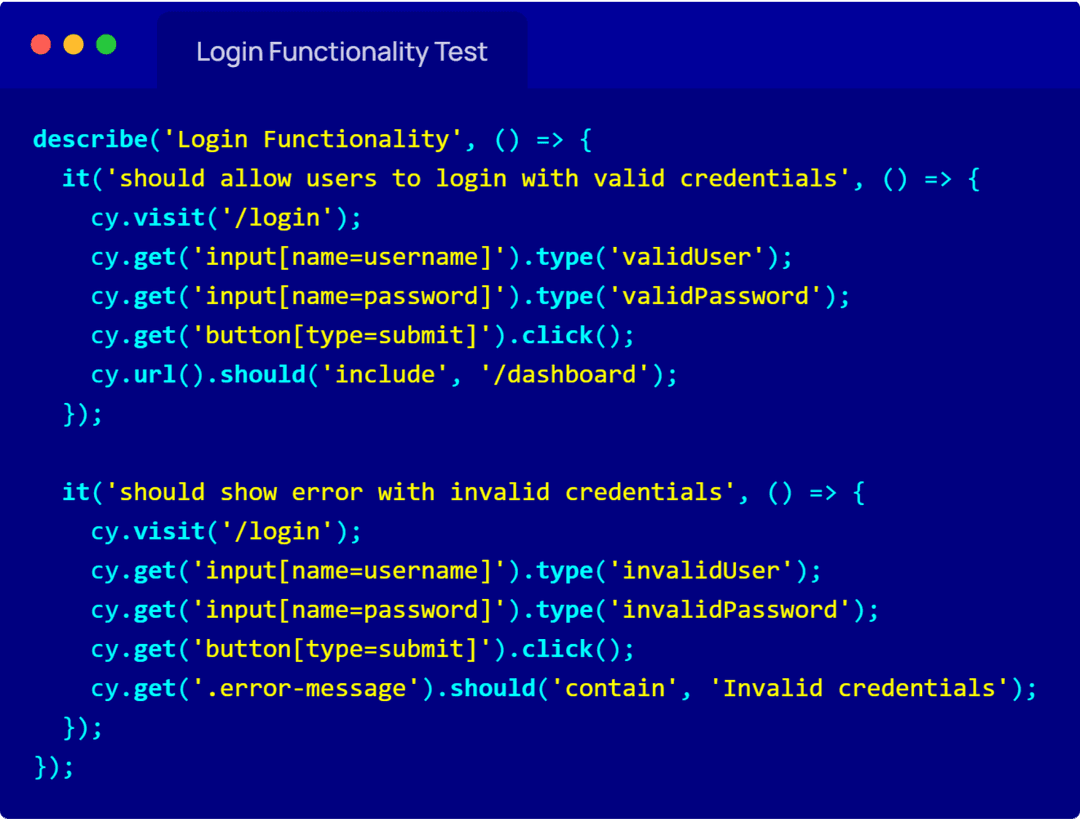
Results & Impact
The redesigned platform resulted in a 30% increase in supplier sign-ups within the first quarter. User feedback highlighted the ease of use and efficiency of the platform, which directly correlated with improved business performance for suppliers.
Before vs. After metrics
Before vs. After Metrics Visualization for Suppliers
Metric Before After Improvement Onboarding Completion Rate 65% (Users dropping out during sign-up due to complexity) 90% (Clear, simplified sign-up process with tooltips) +25% Increase Time to List First Product 45 minutes (Too many product details required) 25 minutes (Simplified product listing form) -44% Time Reduction Supplier Churn Rate 20% (Users leaving due to confusing interface) 10% (Improved user flows and guidance) -50% Reduction Customer Support Queries 200 per week (Common onboarding and order management issues) 80 per week (Fewer issues due to improved user guidance) -60% Reduction in Queries Order Processing Time 15 minutes per order (Difficulty tracking and managing multiple orders) 8 minutes per order (Bulk actions, visual tracking system) -47% Reduction in Processing Time Supplier Satisfaction 60% (Feedback on complexity and confusion) 85% (Feedback on ease of use and guidance) +25% Increase - Significant reductionin onboarding time, product listing time, and customer support queries due to streamlined user flows and simplified interfaces.
- Increased supplier satisfactionIncreased supplier satisfaction with easier navigation and guidance, directly reducing the churn rate and improving platform loyalty.
Before vs. After Metrics Visualization for Aggregators
Metric Before After Improvement Onboarding Time 3 weeks (Complex dashboard setup process) 1 week (Predefined templates, onboarding tutorials) -67% Time Reduction Supplier Management Efficiency 50% (Difficulty tracking multiple suppliers) 80% (Supplier comparison metrics, automated tools) +30% Increase Time Spent on Analytics 3 hours per day (Manual report generation) 1 hour per day (Automated insights and report templates) -67% Time Reduction Supplier Approval Time 2 weeks (Manual supplier onboarding) 3 days (Automated verification process) -79% Time Reduction Aggregator Satisfaction 65% (Struggles with managing supplier data) 90% (Efficient tools and clear insights) +25% Increase Decision-Making Time 2 days (Overloaded with data, hard to gain insights) 1 day (Clear, visual analytics and recommendations) -50% Time Reduction - Improved efficiency in managing suppliers with better tools and dashboards.
- Reduced onboarding and approval time for new suppliers, increasing operational speed.
- Faster decision-making due to automated analytics and reporting, resulting in a more strategic approach to scaling supplier partnerships.
Supplier Metrics:
Aggregator Metrics:
Tangible improvements (performance, user growth, etc.)
Metric Before After Improvement User Onboarding Completion 65% 90% -67% Time Reduction Average Time to List Product 45 minutes 25 minutes -44% Supplier Churn Rate 20% 10% -50% Customer Support Queries 200 per week 80 per week -79% Time Reduction Order Processing Time 15 minutes per order 8 minutes per order -47% Supplier Satisfaction 60% 85% +25% Onboarding Time for Aggregators 3 weeks 1 week -67% Supplier Approval Time 2 weeks 3 days -79% Decision-Making Time 2 days 1 day -50% User Growth and Performance Improvements
 Visualization of user growth and performance improvements in graphs
Reflection & Lessons Learned
Working on Thisco taught me the importance of balancing user-centric design with business goals. I gained valuable experience in managing cross-functional teams and developed a deeper understanding of how to scale B2B platforms in a competitive landscape.
Final Thoughts
The platform now provides an efficient and user-friendly experience, allowing suppliers and aggregators to interact seamlessly. This led to higher user satisfaction, faster supplier onboarding, and improved platform performance, resulting in fewer support queries and reduced churn rates.
The Thisco platform showcases my ability to design user-focused interfaces while managing complex project requirements. I’m excited to bring this experience to new challenges, contributing to innovative solutions in your team.